
Solar Power Production By Countries 2026
Published on 6/16/2026
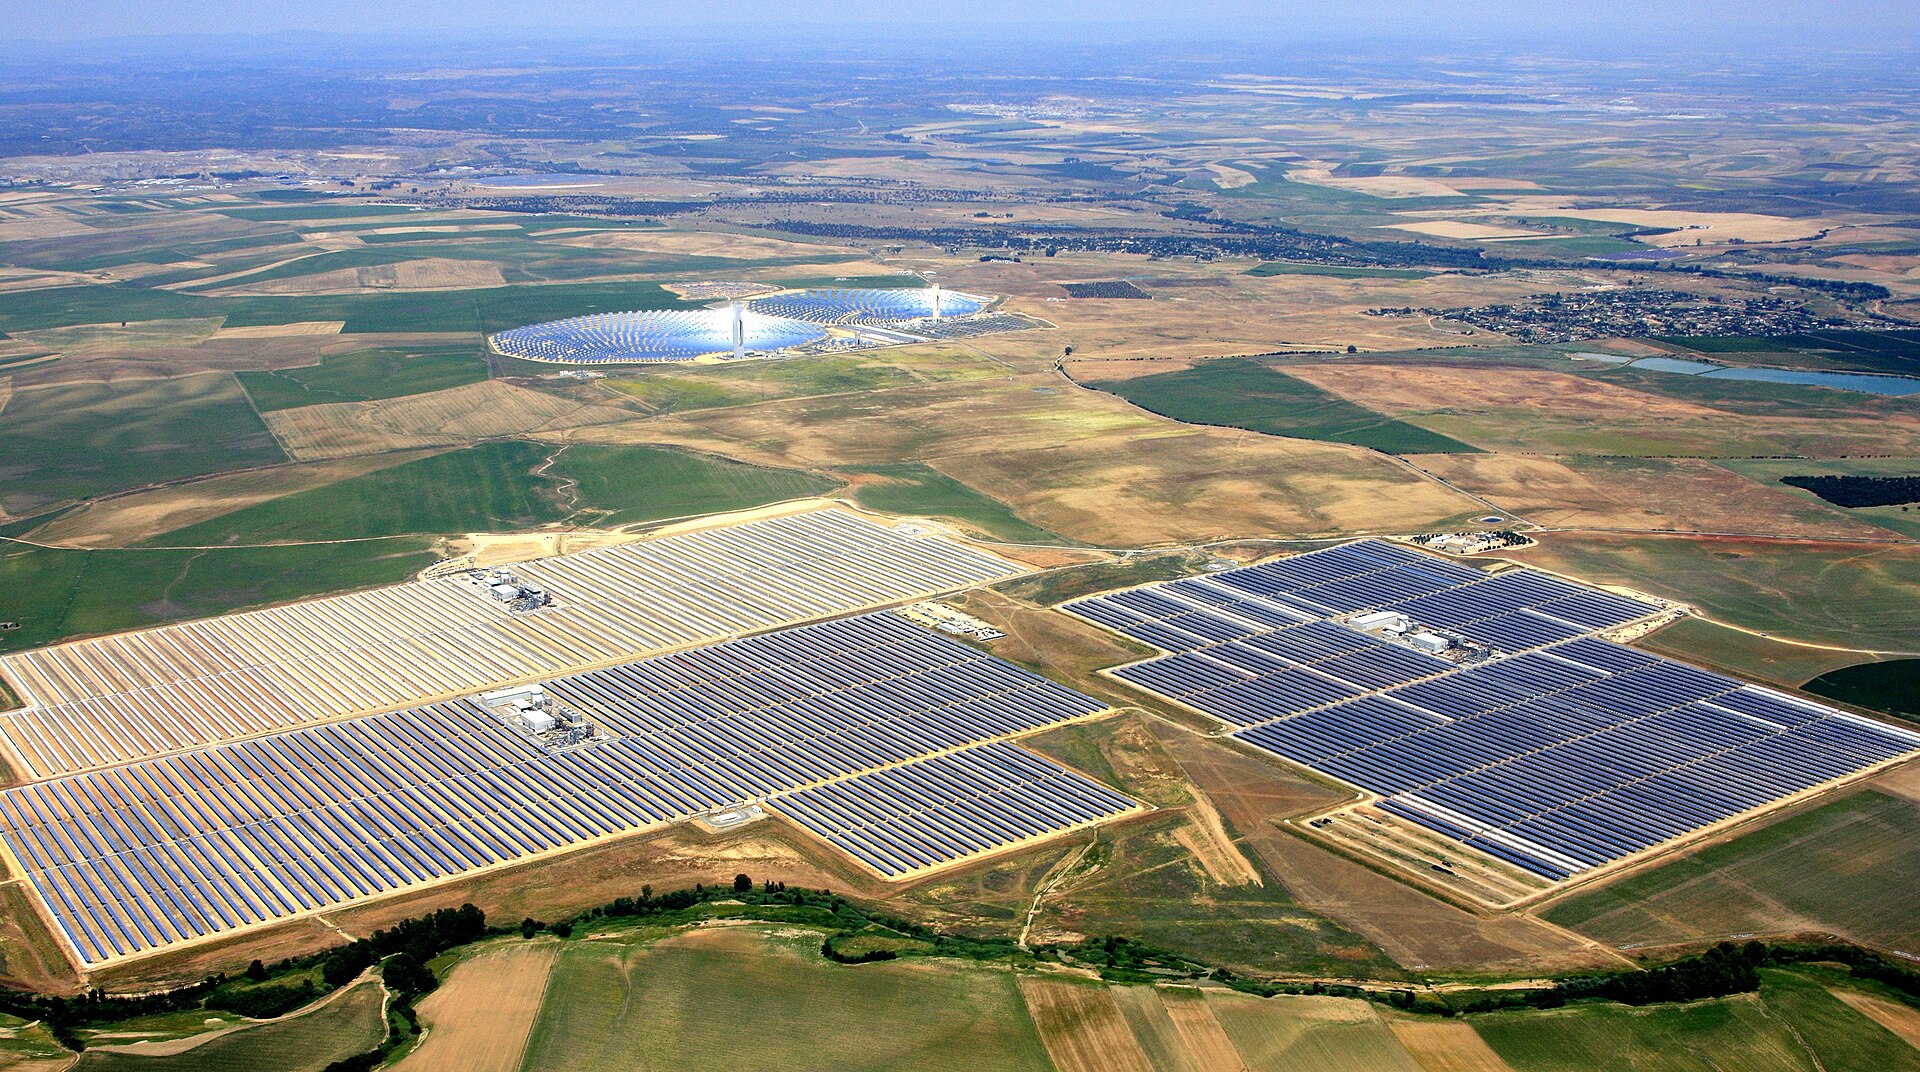
Solar Power Era a Revolutionizing phase of renewable energy.
By mid-2026, global solar energy has grown into a massive power source, with total installed capacity comfortably pushing past 2,500 GW globally. China remains the clear leader in this expansion, operating roughly 1,200 GW of total capacity—meaning it manages more solar infrastructure than the rest of the world combined. Following behind are the United States at 210 GW, India at 135 GW, and Germany leading Europe at 106 GW. Interestingly, the standard way we look at solar capacity is completely changing; the data no longer just tracks massive desert solar farms. Today, distributed on-grid rooftop networks on homes and businesses make up over 40% of the entire global solar mix, turning ordinary energy consumers into active suppliers through net metering. At the same time, decentralized off-grid setups—ranging from rural solar mini-grids in Sub-Saharan Africa to the massive wave of off-grid residential setups sweeping through countries like Pakistan—are completely changing local economies. These independent systems allow millions to completely bypass unreliable national grids, demonstrating that today's solar story is as much about individual energy independence as it is about national utility grids.
List of Countries By total Operational Solar Production
| Rank | Countries | Solar Capacity in GigaWatt |
|---|---|---|
| 1 | 🇨🇳 China | 1200 GW |
| 2 | 🇺🇸 United States | 210 GW |
| 3 | 🇮🇳 India | 135 GW |
| 4 | 🇩🇪 Germany | 106 GW |
| 5 | 🇧🇷 Brazil | 63 GW |
| 6 | 🇯🇵 Japan | 59 GW |
| 7 | 🇵🇰 Pakistan | 51 GW (Massive off Grid) |
| 8 | 🇪🇸 Spain | 42 GW |
| 9 | 🇦🇺 Australia | 40 GW |